Back to index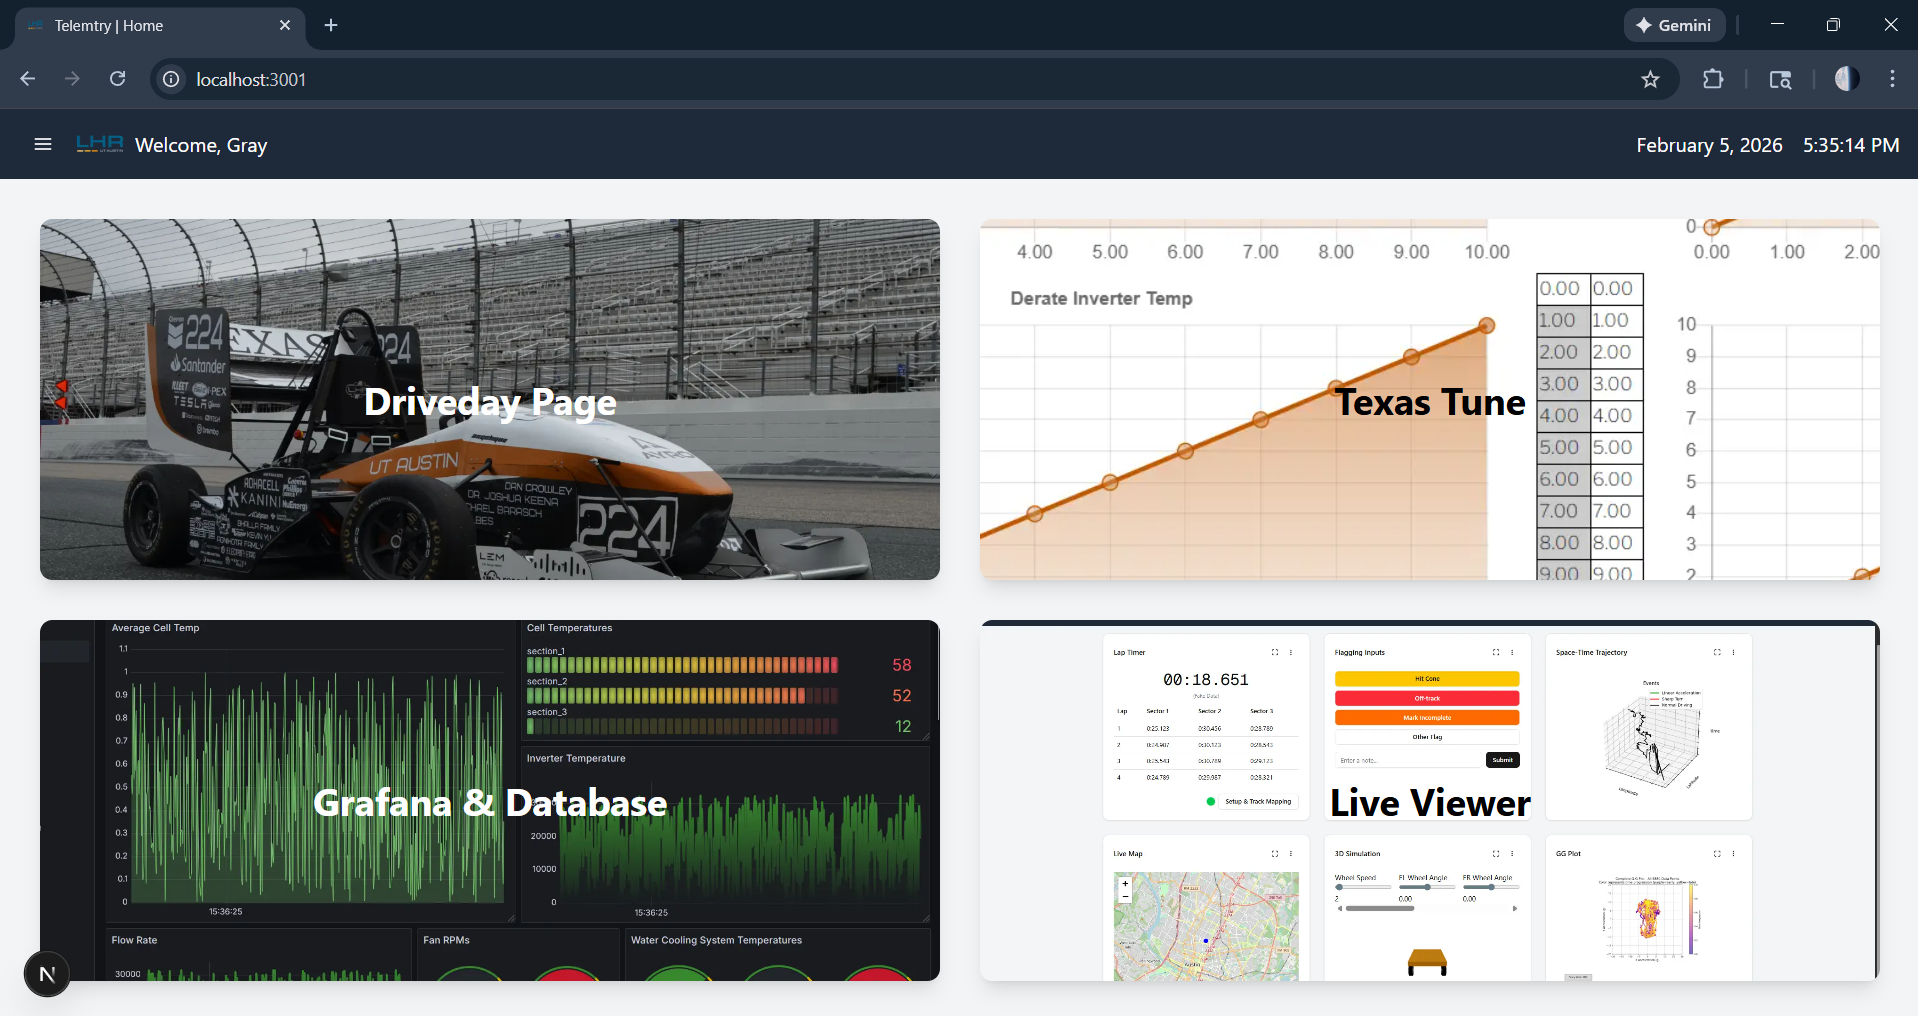
● Live/2024 — 2026
Formula SAE EV Telemetry System.
Distributed Real-Time Vehicle Telemetry & Analytics Platform
Login may be required
FIG. · fsae
I.
Summary
Overview
A distributed, multi-car telemetry platform for Longhorn Racing Electric's FSAE fleet — on-car protobuf emission over MQTT, Kafka streaming, multi-schema Postgres persistence, and live visualization via both Grafana and a custom Next.js viewer tool. Built alongside the rest of the telemetry team; I own the web layer and drive the overall data architecture.
II.
Breakdown
Highlights
- I.Multi-car distributed telemetry: on-car protobuf → MQTT → Kafka → Postgres, fed into live Grafana dashboards and a custom Next.js viewer tool.
- II.Own the web viewer end-to-end — NextAuth, Prisma across three schemas, live Kafka + historical Postgres, Leaflet track maps, D3 / Chart.js / three.js plots.
- III.Drive overall data pathing and schema planning across the stack — from CAN signals on-car through to engineers' screens in the pit.
III.
Margin
Notes
- §Co-architected and maintain a multi-car telemetry platform spanning on-car protobuf emission, MQTT + Kafka streaming, multi-schema Postgres persistence, and live visualization via Grafana alongside a custom Next.js viewer — built as a team, with other engineers owning the processor services and parts of the ingest layer.
- §Own the Next.js 15 viewer tool end-to-end: NextAuth + Prisma across three schemas (auth / telemetry / per-car), a kafkajs live consumer for realtime plots, historical Postgres queries, Leaflet track maps, D3 / Chart.js / three.js visualizations, and a drag-and-drop dashboard layout. Runs trackside over Tailscale/LAN.
- §Drive overall data pathing and schema planning — whiteboarded how signals flow CAN → protobuf → MQTT → Kafka → processors → Postgres + live viewers, and locked in the database schemas (`angelique`, `orion`, `nightwatch`) before implementation began.
- §Led system redesign and modernization after original authorship transitioned: moved the stack into a Bazel + docker-compose monorepo layout and stood up `server_devtool.sh` as a single-command trackside launcher (Kafka + Postgres + MQTT handler + auto-generated Prisma clients + viewer dev server).
- §Live + retrospective dashboarding: realtime Grafana panels fed by a custom Kafka datasource plus retrospective Postgres-sourced dashboards for post-session analysis, all co-hosted at `lhrelectric.org/grafana` alongside the viewer tool.
- §Focused on reliability and latency under real track conditions — spotty trackside connectivity, high-frequency CAN data loads, and a team-built platform where other engineers own processor services (lap timing, GPS classification, track mapping, GG-plot) that plug into the same Kafka + database layer.
By the numbers
1000
hz
<40ms
p99
120+
signals
Other work
Live · 2025 — Present
Longhorn Sim Racing Platform
Events, Membership & Competition Management Platform
Next.js 16 · TypeScript · Prisma
Live · 2025 — 2026
In-Vehicle Driver Dash System
Multi-Screen Real-Time Driver Display for the LHRE FSAE Car
React · TypeScript · Rust
In Development · 2026 — Present
Longhorn Racing Autonomous Platform
FSAE driverless simulation + control stack for Longhorn Racing's autonomous program.
ROS 2 · Python · Gazebo